Image Grok Imagine
Immersive Insight into 3D Creation Through Blender's Debug View
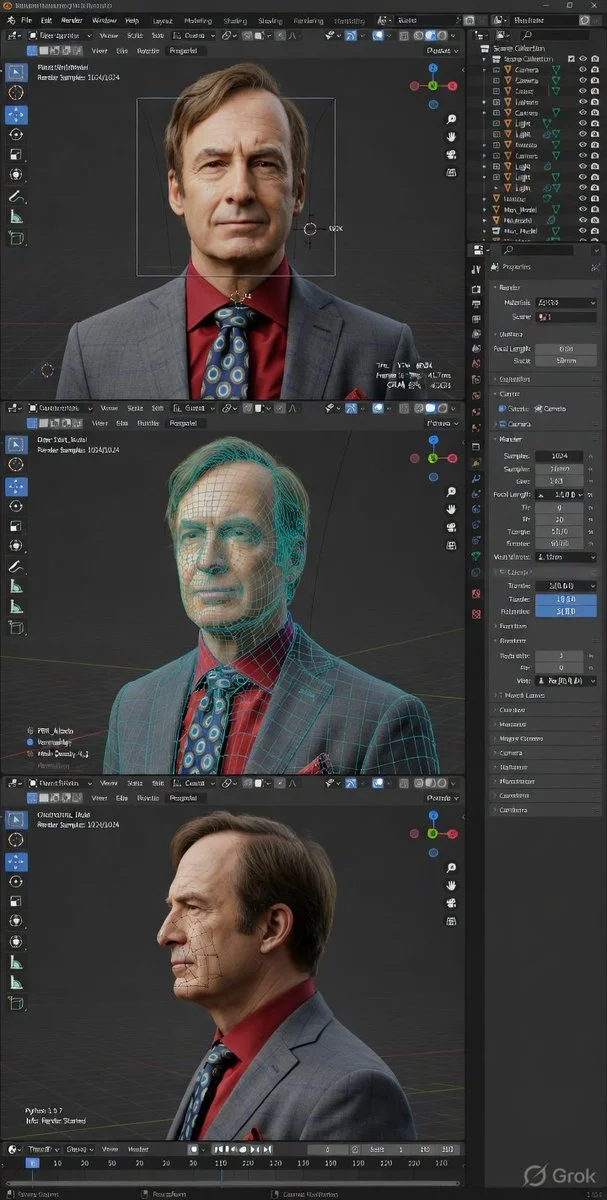
Explore a hyper-realistic Blender interface capturing the complexity behind digital art, blending photorealism and wireframe overlays to reveal the anatomy of creative software in action.
Prompt
High-fidelity 3D software interface screenshot, Blender (dark theme) in developer/debug mode, ultra-detailed precision UI, hyper-realistic render + technical diagnostics overlay, crisp, high-resolution screen capture.Blender layout visible: top menu & workspace tabs (Layout, Modeling, Shading, Rendering), outliner (structured hierarchy), properties panel (render, materials, scene, camera expanded), timeline (frame indicators), left toolbar, bottom debug console.

Developer overlays ON: FPS, frame time (ms), GPU/CPU usage, VRAM, polygon count (tris/verts), object stats, render samples, camera transform data.
Three vertically stacked viewport panels (9:16): • Front (orthographic feel)• Three-quarter (slight perspective)
• Side profile

Each with grid, XYZ gizmo, bounding box, pivot, camera guides.
Same objects in all panels, facial identity locked, neutral expression, anatomically consistent.

UE5 + Octane hybrid rendering: cinematic lighting, path tracing, global illumination, ray tracing, soft shadows, subsurface scattering, accurate reflections.Debug material blend: photorealistic render + glowing wireframe + partial topology + subtle heatmap/normal hints, seamlessly merged.

Shader/node indicators visible: PBR nodes, texture slots (albedo/normal/roughness), floating debug labels, mesh density tags.
Viewport environment: dark grey gradient, fine grid, clean technical workspace.

Dense UI: compact icons, sliders, numeric values, toggles, sharp anti-aliased text, no empty space.

True screen capture look, ultra-sharp, no DOF or blur.
Published: April 6, 2026 by @Goodmanprotocol